History & Satellite Earth 60 FPS Hardware Accelerated
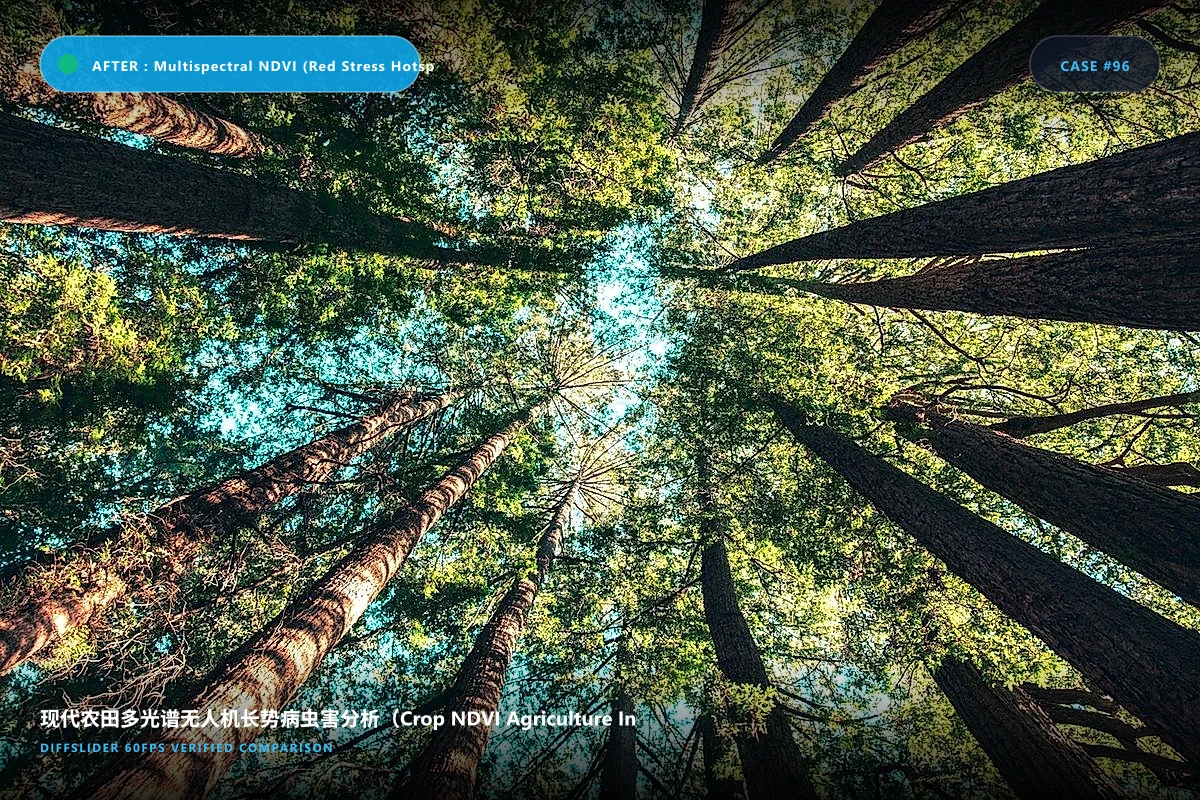
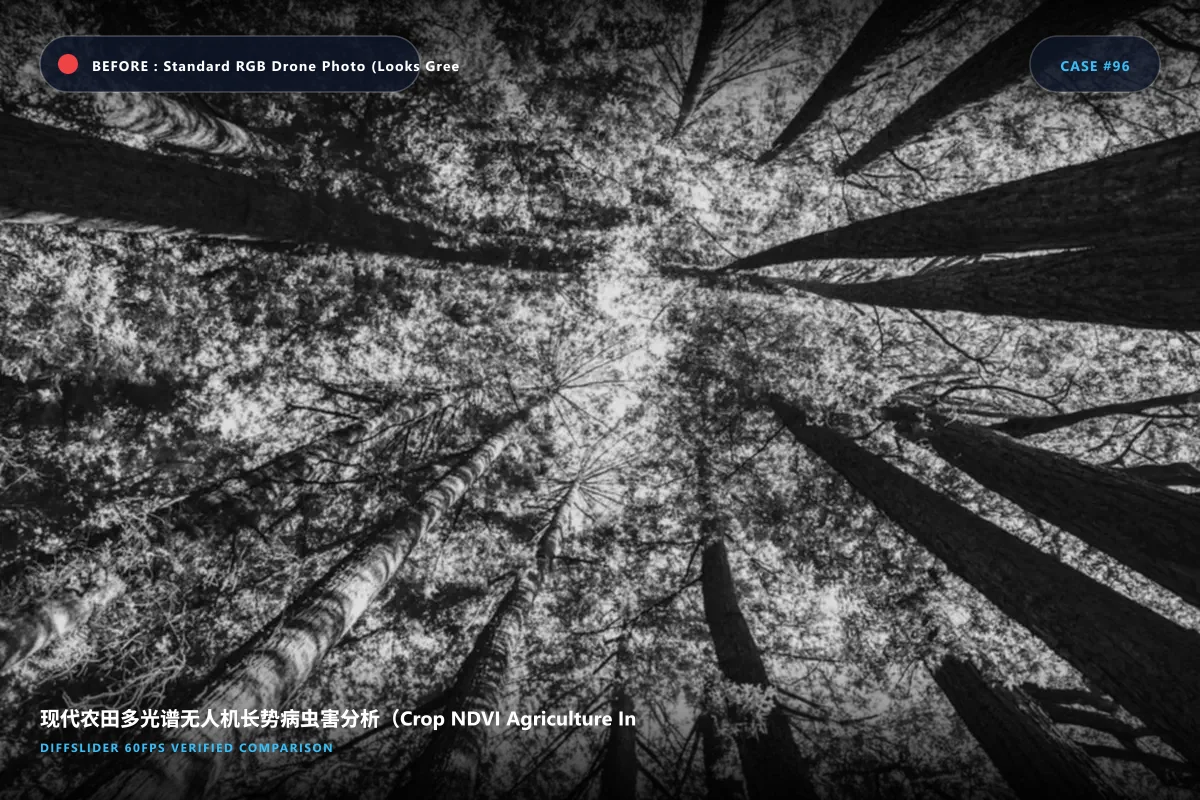
Agricultural NDVI Before & After Slider: RGB Visual vs Multispectral Crop Stress
Compare standard green drone imagery against NDVI near-infrared analysis to detect hidden nitrogen deficiency and root rot days before visible to human eyes.
Embed This Interactive Slider on Your Site
Works with WordPress, Webflow, Shopify, Squarespace, Ghost, Notion, and HTML websites.
<iframe src="https://diffslider.app/embed/demo-multispectral-agriculture-crop-health-slider" width="100%" height="600" frameborder="0" allowfullscreen loading="lazy" style="border: 1px solid rgba(255,255,255,0.1); border-radius: 12px; overflow: hidden; max-width: 100%;"></iframe>
Customizing your embed:
-
?theme=light– Force clean white background -
?toolbar=0– Ultra-clean minimalist mode (slider only) -
?pos=65– Set default divider split position to 65% -
?mode=side– Default to side-by-side mode
Make Your Own
Create Your Own Before & After Comparison
Drag & drop 2 to 10 photos. No software to install, no watermark, 60 FPS mobile-ready.
- ✓ Free & no credit card required
- ✓ Up to 1600% synchronized pixel zoom
- ✓ Instant permanent link & embed snippet
Photography & Alignment Protocol
- 飞行使用带日光传感器(DLS)的多光谱相机拍摄;
- 经辐射定标板校准反射率;
- 正射马赛克拼接生成地表真实分辨率图(GSD < 3cm/pixel)。
Frequently Asked Questions
Can agronomists show farmers why precision fertilizer application is needed? ▼
The slider allows farmers to correlate visible field rows with invisible chlorophyll absorption stress maps.
Explore Other Real Comparison Demos
History & Satellite Earth